Dive into neoCoder’s data-driven world
Structure your developers learning journey by banking on our platform’s powerful data-driven insightful analytics. Experience a comprehensive view of the developers learning graph with an eye for essential performance metrics – to collaborate, intervene and provide guided assistance whenever required.
neoCoder’s powerful analytics feature will enable your mentors to predict the developers’ performance and also offer personalized experiences by tailoring custom training programs. Get a strong foothold on your training modalities with neoCoder’s data-driven model.
Sonar Cloud Insights
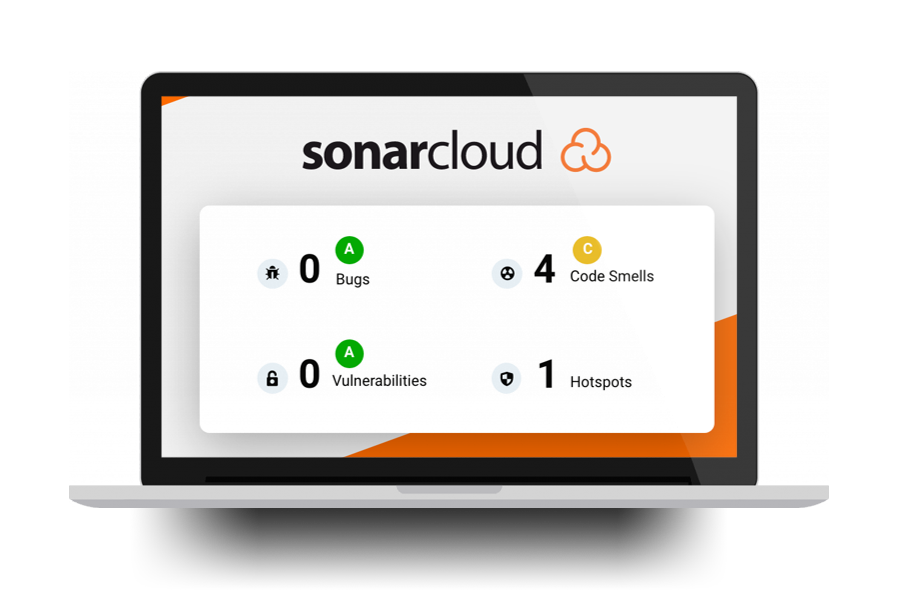
As your developers constantly produce multiple lines of code, it’s integral to ensure the code quality and safety are equally taken care of. To smoothen this process for your mentors, our platform offers powerful Sonar Cloud insights that help you to effectively deal with code vulnerabilities and improve coding efficiency. neoCoder’s integration with the Sonar Cloud aids mentors to conduct regular code analysis and standardize the quality of code.
- Automatically detects the bugs and vulnerabilities in the IDE
- Helps mentors detect and fix the code smells and code duplications
- Pull request analysis to analyze all the code changes that were newly introduced
- Quality gates to validate if the code meets the desired quality and security requirements
Git Code Analysis
Don’t let your developers just code rather empower them to create a standardized coding journey with data-driven insights.
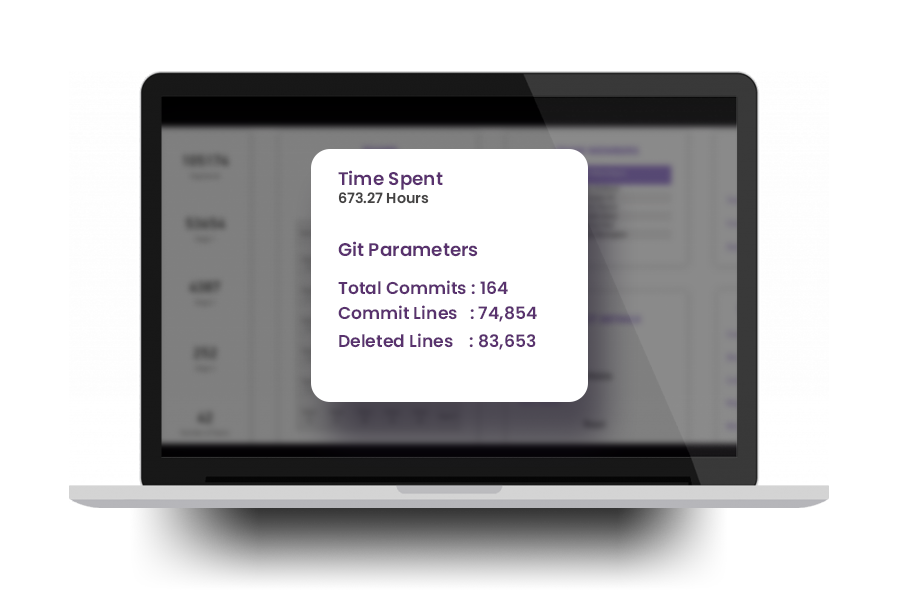
The Git code analysis offers pivotal insights like git stats, code issues, pull requests, total commits, and diverse key metrics – to help teams improve their code performance and drive better results. Get a data-rich statistical analysis report of your team’s code quality with just a few clicks.
With Git Code analysis, your mentors get access to a wide array of metrics that include individual contributions, code changes, issues, build stats, unit test info, total time spent, and plenty more.
- Get deep insights into developers’ active participation, their individual contribution to the team, overall progress and performance.
- Determine the workflow patterns, and common bottlenecks to help improve the overall efficiency.
Code Plagiarism Checker
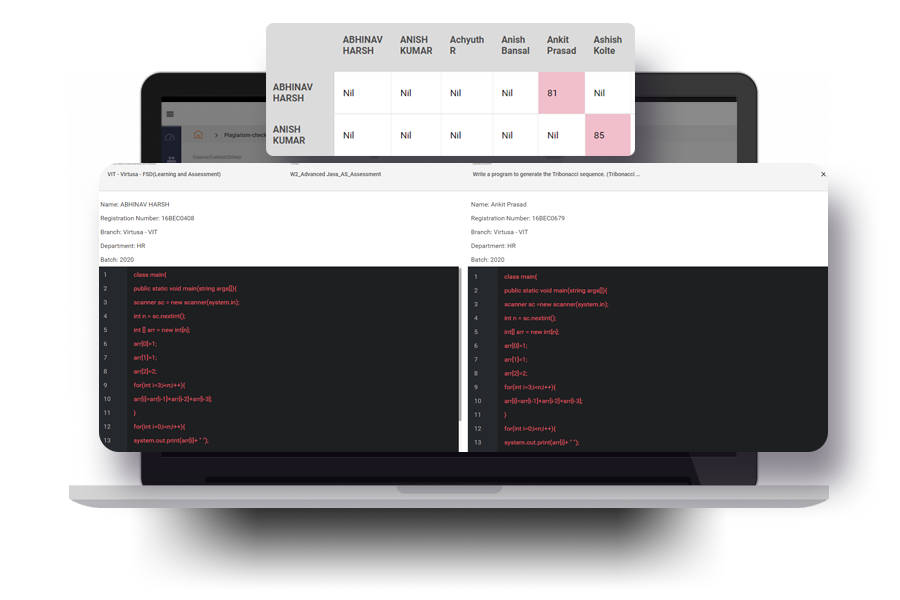
Validate all deliberate and accidental code plagiarism with neoCoder’s efficient and precise code plagiarism checker. Our AI-based code plagiarism checker will help mentors detect plagiarised codes in the assessments/assignments by leveraging the MOSS algorithm.
Check for plagiarism, and code infringement within teams/peers to ensure there are no code similarities. The effective copy-detection MOSS algorithm will help mentors validate question-wise code submissions through matrix-based peer-to-peer plagiarism evaluation.
The plagiarism checker explicitly picks out the lines of the code within a program that maps with other similar code instances.
- Rule-based checker to identify plagiarised code and categorise developers based on the percentage of code copied between two assignments.
- Go beyond basic text and syntax checker with MOSS’s advanced capabilities like whitespace insensitivity, position independence, and noise suppression.
- Evaluate complex, algorithm-based and data structure programs hassle-free with neoCoder
- Deeper insights like developers’ active participation period and submission time will determine the plagiarism source.
Batch-Wise Dashboards
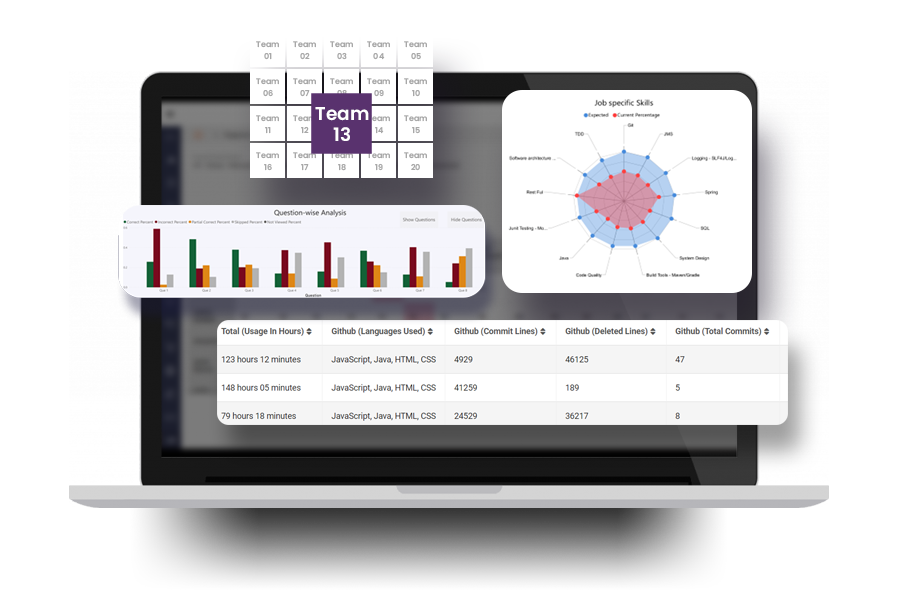
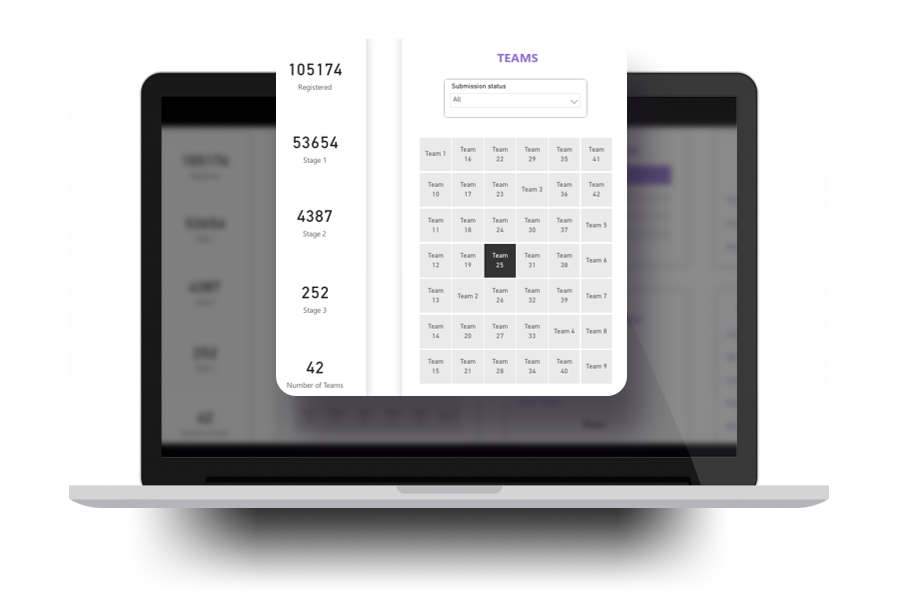
Enhance your developers learning graph with insightful analytics that includes batch-wise dashboards, supported by micro-level performance reports, and individual dashboards.
Our batch-wise dashboards encompass the overall participation and performance data with clear delineations of key metrics that include project details, team-wise performance, time spent on projects, code efficiency and several more insights.
Mentors can effortlessly download the dashboard data as excel files and use them for their future reference.
The batch-wise dashboards will aid your mentors:
- Get instant access to all performance metrics
- Analyse team-wise performance
- Define learning trajectories for the team members
Build Custom Reports and Dashboards with Power BI
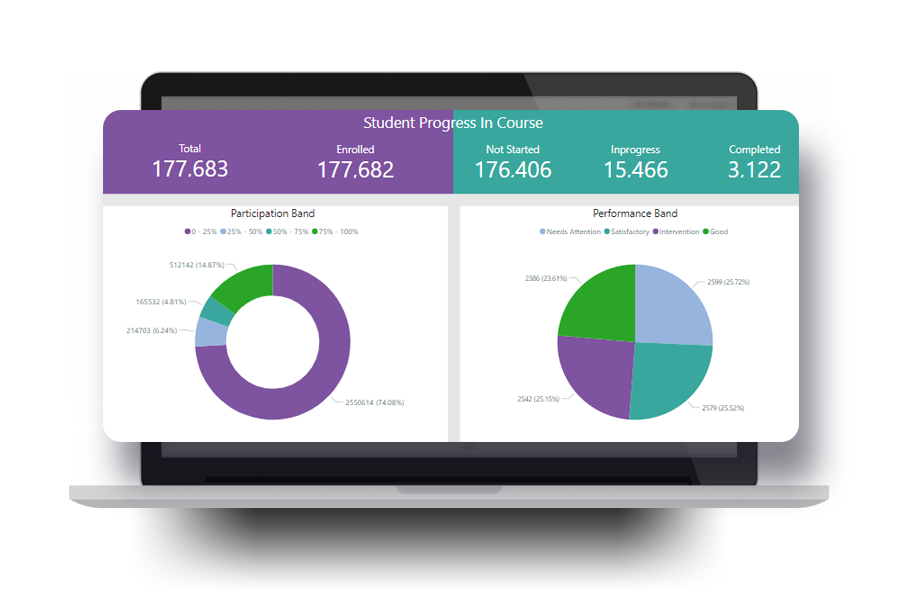
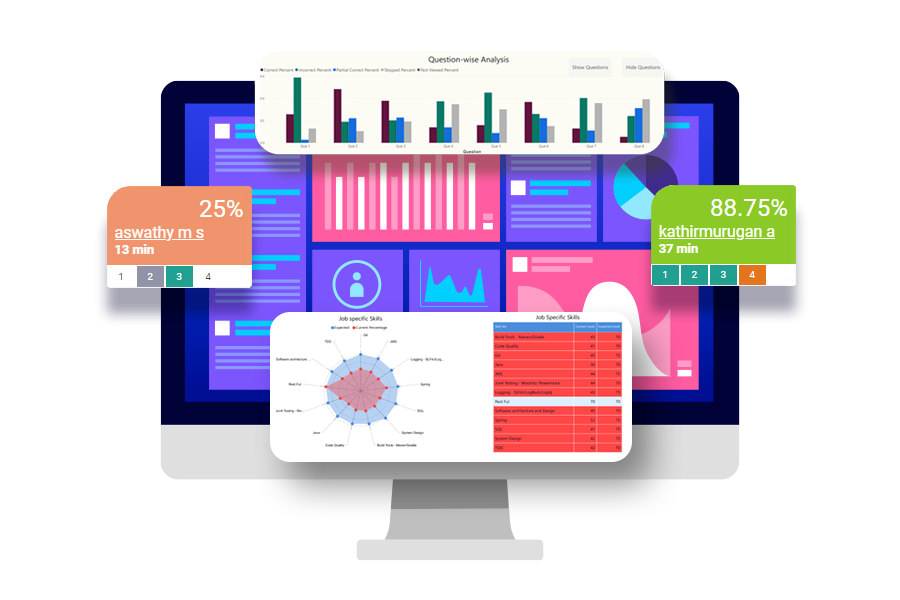
Pull custom reports and get customized dashboard views hassle-free with neoCoder. Our platform offers a wide array of elite reports that can be customized and downloaded based on the mentor’s diverse report requirements. Our customizable Power BI-enabled dashboard and reports will help you constantly monitor the developers’ learning progress with real-time analytics.
- Get an eagle-eyes view of all your developers’ progress and access their individual reports anytime with ease.
- The platform supports automatic categorization and grouping of developers based on their live performance.
- Track your developers’ growth in different aspects over time to ensure they’re on the right path to meet their objectives.
Other Significant Reports
In addition to the above insights, our platform also offers in-depth skill reports that can be leveraged by the trainers to perform skill gap analysis and make data-driven decisions based on job-specific skills. Some of the unique reports that mentors can leverage within the platform are course-wise reports, test-wise reports, platform usage reports, contest reports, downloadable pdf reports, driver-wise reports and placement reports.
- For each report type, you have unique subreports that offer deep insights like participation summary, performance summary and plenty more.
- You can download any report as an excel file and use it for future reference.
- Acquire a detailed summary of the developer’s learning curve with our value-added reports.

